⚠️⚠️⚠️ The documentation and website are currently under construction for the next release. ⚠️⚠️⚠️
Overview
The sprtt package is a sequential probability ratio tests toolbox (sprtt).
The package contains:
seq_ttest(),seq_anova()calculates sequential t-test and sequential one-way ANOVAsplot_anova()plots results of sequential ANOVAsplan_sample_size()creates comprehensive HTML reports with sample size recommendations based on pre-computed SPRT simulationsdraw_sample_normal(),draw_sample_mixture()simulation of data setsthree data sets (
df_income,df_stress,df_cancer) to run the examples in the t-test documentation
Installation
Release version from CRAN
This is the recommended version for a normal user.
# installs the package
install.packages("sprtt")
Development version from GitHub
To get a bug fix or to use a feature from the development version, you can install the latest version from GitHub.
# the installation requires the "devtools" package
# install.packages("devtools")
# stable GitHub version
devtools::install_github("MeikeSteinhilber/sprtt")

# development version, may not be stable
devtools::install_github("MeikeSteinhilber/sprtt", ref="develop")
Documentation
Detailed documentation can be found on the home page. There are several articles (called vignettes in R) covering the usage of the package and its functions.
Short examples can be found in the following paragraph.
Quick Examples
Note
In the R code sections:
# comment: is a comment
function(): is R code
#> results of function(): is console output
# set seed --------------------------------------------------------------------
set.seed(333)

# load library ----------------------------------------------------------------
library(sprtt)
#> Note: Sample size planning functions require simulation data (~150 MB).
#> Data will download automatically on first use.
#> See ?download_sample_size_data for more information.

# t-TEST ----------------------------------------------------------------------
# one sample: numeric input ---------------------------------------------------
treatment_group <- rnorm(20, mean = 0, sd = 1)
results <- seq_ttest(treatment_group, mu = 1, d = 0.6)

# get access to the slots -----------------------------------------------------
# @ Operator
results@likelihood_ratio
#> [1] 323.9051

# [] Operator
results["likelihood_ratio"]
#> [1] 323.9051

# ANOVA -----------------------------------------------------------------------
# simulate data ---------------------------------------------------------------
set.seed(333)
data <- sprtt::draw_sample_normal(k_groups = 3,
                                  f = 0.15,
                                  sd = c(1, 1, 1),
                                  max_n = 46)
# look at the data
head(data)
#>            y x
#> 1  0.2762330 1
#> 2 -1.3415005 2
#> 3 -0.4521177 3
#> 4  1.2315479 1
#> 5  0.8180678 2
#> 6  0.1697634 3

# calculate sequential ANOVA --------------------------------------------------
results <- sprtt::seq_anova(y ~ x, f = 0.15, data = data, plot = TRUE)
# test decision
results@decision
#> [1] "accept H1"
# test results
results
#>
#> *****  Sequential ANOVA *****
#>
#> formula: y ~ x
#> test statistic:
#>  log-likelihood ratio = 3.061, decision = accept H1
#> SPRT thresholds:
#>  lower log(B) = -2.944, upper log(A) = 2.944
#> Log-Likelihood of the:
#>  alternative hypothesis = -3.839
#>  null hypothesis = -6.9
#> alternative hypothesis: true difference in means is not equal to 0.
#> specified effect size: Cohen's f = 0.15
#> empirical Cohen's f = 0.3255325, 95% CI[0.1324216, 0.4835088]
#> Cohen's f adjusted = 0.296
#> degrees of freedom: df1 = 2, df2 = 135
#> SS effect = 12.83987, SS residual = 121.1635, SS total = 134.0034
#> *Note: to get access to the object of the results use the @ or [] instead of the $ operator.

# plot results -----------------------------------------------------------------
sprtt::plot_anova(results)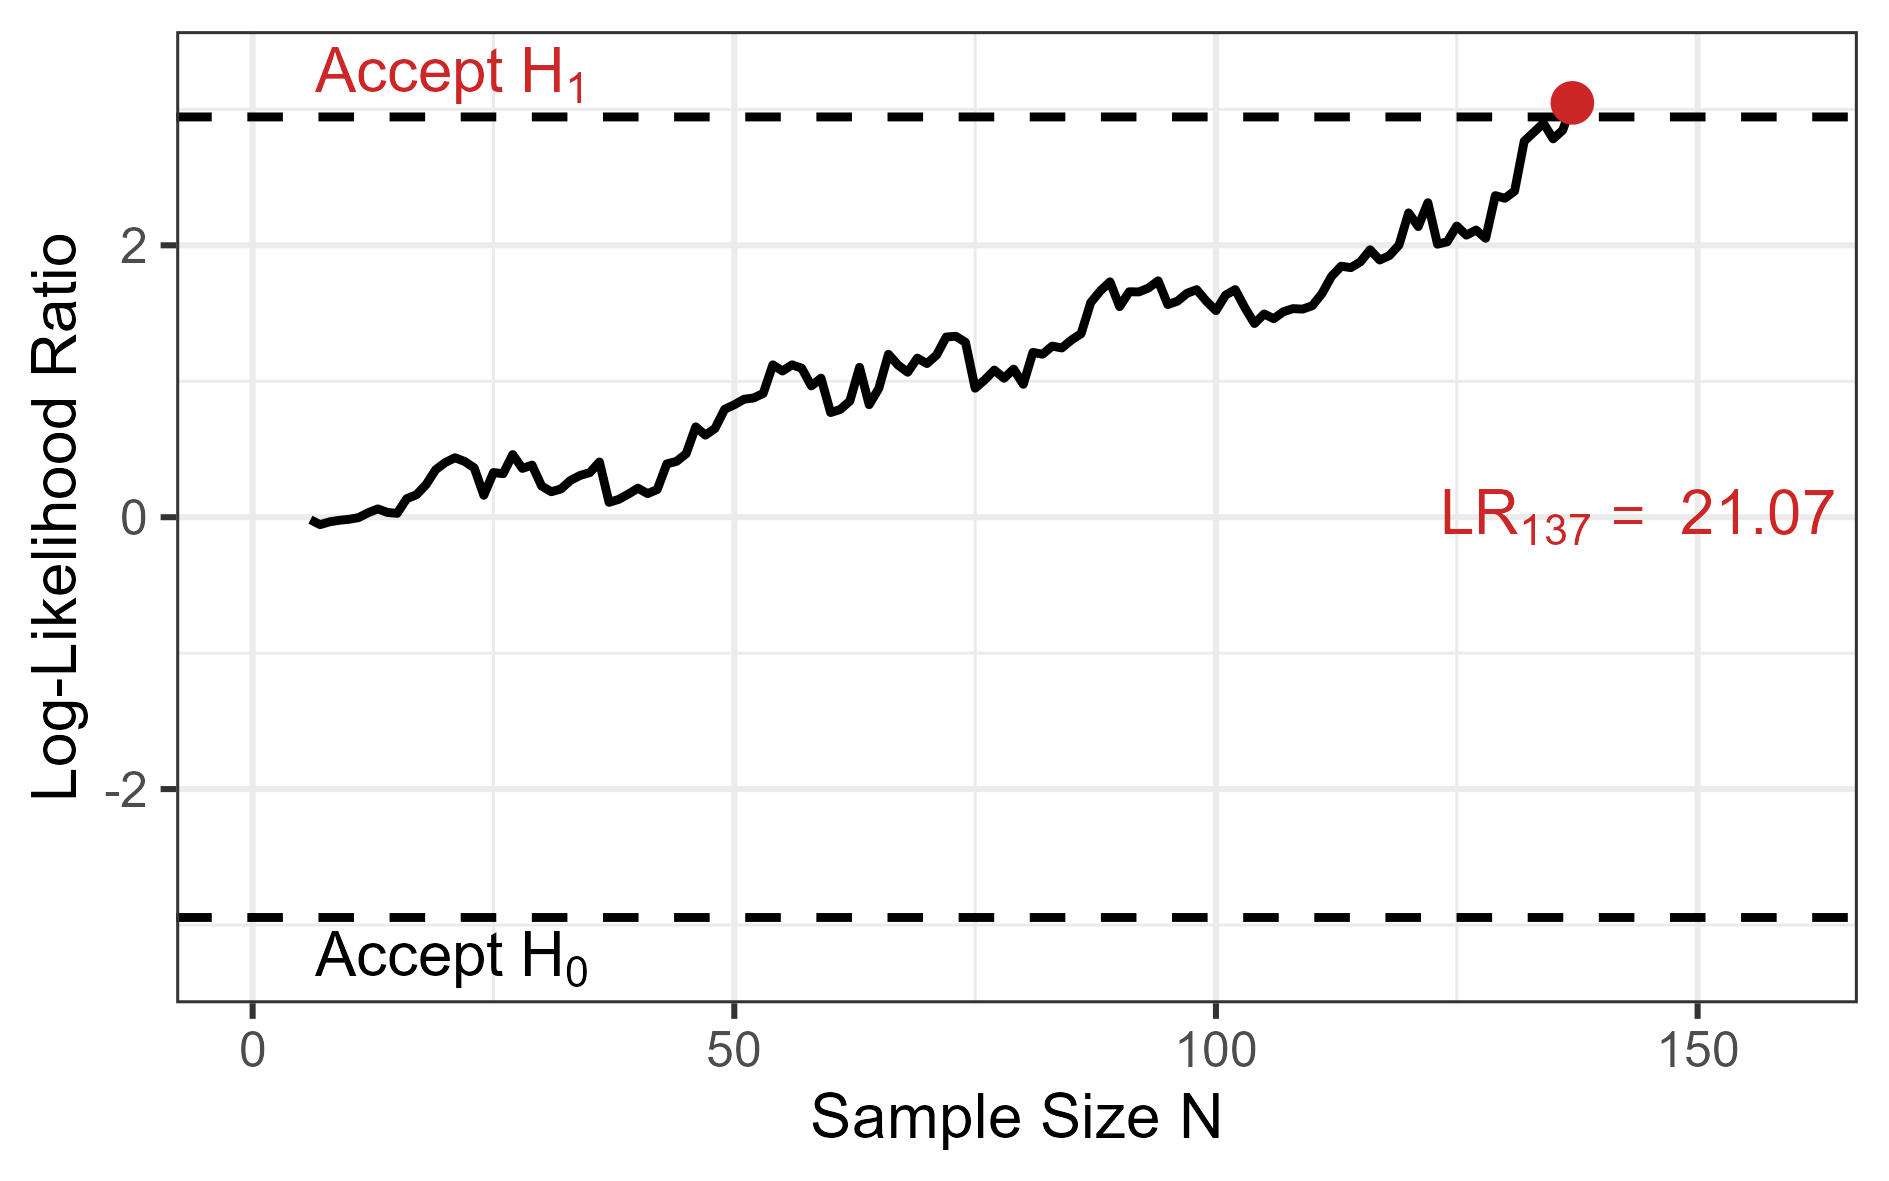
# save the plot ----------------------------------------------------------------
ggplot2::ggsave(
  "man/figures/readme_example.png",       # define the path
   units = "cm", height = 10, width = 16, # define the image size
   dpi = 300                              # define resolution
  )
Sample Size Planning
The sample size planning function requires simulation data (~150 MB). On first use, this data will be downloaded and chached automatically:
sprtt::plan_sample_size(f_expected = 0.25,
                        k_groups = 3,
                        beta = 0.05,
                        decision_rate = 0.85)
The package contains functions to help managing the cached data, if necessary.
Managing cached data
# Check cache status
sprtt::cache_info()

# Force re-download (if data was updated)
sprtt::download_sample_size_data(force = TRUE)

# Clear cache
sprtt::cache_clear()
If you need to use the package offline, download the data while connected beforehand.